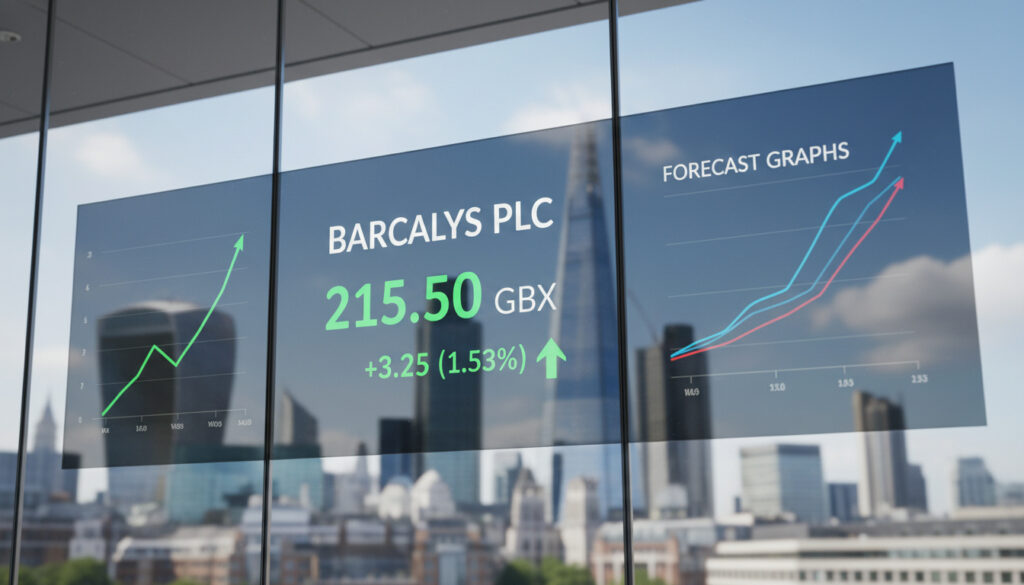
Barclays PLC Share Price – Live Quote Analysis Forecast
Barclays PLC shares closed at 386.25 GBX on March 13, 2026, continuing a downward trajectory that has defined the first quarter of 2026 for the London-listed banking group. The stock opened at 383.50 GBX and traded within a range of 379.75 GBX to 391.85 GBX, with volume reaching nearly 75 million shares.
The LSE:BARC ticker has declined significantly from January averages above 486 GBX, reflecting broader pressures on UK financial equities. Real-time data discrepancies exist across platforms, with some sources reporting figures that differ from official exchange closes due to timing variations and after-hours trading activity.
What is the Current Barclays PLC Share Price?
| Current Price 386.25 GBX |
% Change -0.80% |
Volume 74.97M |
Market Cap Not disclosed |
- Year-to-date decline of approximately 20% from January highs of 486.20 GBX
- Beta coefficient of 1.676 indicates volatility significantly above market average
- One-year performance remains positive at +33.29% despite recent weakness
- Weekly recovery trend of +9.55% contrasts with monthly decline of -4.96%
- Trading volume on March 13 reached 74,968,668 shares
- Price discrepancies reported between TradingView (404.45 GBX) and LSE official closes
| Metric | Value | Source Status |
|---|---|---|
| Last Close (Mar 13) | 386.25 GBX | LSE Official |
| Open (Mar 13) | 383.50 GBX | LSE Official |
| Daily High | 391.85 GBX | Investing.com |
| Daily Low | 379.75 GBX | Investing.com |
| Prior Close (Mar 12) | 389.35 GBX | Investors Chronicle |
| Volume | 74,968,668 | LSE Official |
| Beta | 1.676 | Investors Chronicle |
| P/E Ratio | Not available | Unverified |
| Dividend Yield | Not available | Unverified |
| Market Cap | Not available | Unverified |
| 52-Week High | Not specified | Unverified |
| 52-Week Low | Not specified | Unverified |
Barclays Share Price Performance and Historical Chart
Recent Trading Sessions
March 12, 2026, marked a particularly volatile session, with the stock closing at 389.35 GBX, down 5.09% or 20.90 GBX from the previous day. Volume surged to 87.20 million shares, significantly above average daily levels. The session saw prices swing between a high of 408.90 GBX and a low of 385.30 GBX.
The following day, March 13, continued the downward pressure with a close of 386.25 GBX, though the decline moderated to -0.80%. Trading volume normalized to 74.97 million shares, with the intraday range tightening to 379.75 GBX–391.85 GBX.
Long-Term Trajectory
Monthly averages reveal a steep decline throughout 2026, with January opening at 486.20 GBX, February averaging 452.85 GBX, and March collapsing to 389.35 GBX. Historical data indicates the stock traded at significantly lower levels in 2024, progressing from December 2023 averages near 144–153 GBX to May 2024 levels around 213–220 GBX.
Long-term historical peaks reached 232 GBX in October 2015, while post-Brexit lows in June 2016 saw prices around 138.60 GBX. The current yearly performance of +68.24% remains robust despite recent quarterly weakness.
Price discrepancies between TradingView’s reported 404.45 GBX and the London Stock Exchange’s official 386.25 GBX close reflect timing differences between real-time feeds and exchange-reported closes. The LSE notes potential 20-minute delays in official data.
Key Financial Metrics for Barclays Stock
Valuation Measures
Explicit figures for Barclays’ market capitalization, price-to-earnings ratio, and earnings per share remain unavailable in current exchange data and financial databases. These metrics typically appear in comprehensive investor relations filings.
Dividend and Income Data
Dividend yield information remains unspecified in current data sources, though historical policies have varied based on regulatory capital requirements and earnings performance. Investors seeking income metrics should consult Barclays’ official investor relations portal for declared distributions.
Barclays Share Price Forecast and Outlook
Analyst consensus targets for BARC stock indicate a maximum projection of 500.00 GBX and minimum support at 350.00 GBX. These figures represent forward-looking estimates without specific 2025 timelines attached.
Forward-looking estimates suggest potential upside to 500.00 GBX or downside risk to 350.00 GBX based on current analyst models. These projections depend on interest rate environments, regulatory capital requirements, and macroeconomic stability.
Analyst targets represent estimates rather than guarantees. Actual performance may diverge significantly due to market volatility, sector rotation, or unforeseen economic events. The wide spread between maximum and minimum targets reflects substantial uncertainty in banking sector valuations.
Barclays Share Price Timeline: Key Trading Sessions
- : Closed at 437.35 GBX (Open 436.10, High 437.38) – Investors Chronicle
- : Declined to 404.15 GBX (Low 400.55) – Investors Chronicle
- : Further drop to 397.40 GBX (Volume 66.73m) – Investors Chronicle
- : Sharp decline to 389.35 GBX, down 5.09% on 87.20m volume – Investors Chronicle
- : Closed at 386.25 GBX (Volume 74,968,668) – LSE Official
- : Historical monthly peak averaging 232 GBX – Digrin
- : Post-referendum low around 138.60 GBX – Digrin
Established Facts and Information Gaps
| Verified Data | Unclear or Unavailable |
|---|---|
| Current price: 386.25 GBX (Mar 13 close) | Market capitalization |
| Daily volume: 74.97 million shares | P/E ratio |
| Beta: 1.676 | Dividend yield percentage |
| YTD decline from 486.20 GBX to 389.35 GBX | Earnings per share |
| Analyst targets: 350–500 GBX range | Specific 2025 forecast timelines |
| Employee count: ~93,000 | Real-time market cap valuation |
Barclays Market Context and Scale
Barclays PLC maintains a workforce of approximately 93,000 employees as of March 2026, operating as a systemically important financial institution on the London Stock Exchange. The bank’s share price serves as a barometer for UK banking sector health, with volatility metrics suggesting heightened sensitivity to macroeconomic policy announcements.
The stock’s beta coefficient of 1.676 indicates amplified reactions to broader market movements, making it a higher-risk, higher-potential-reward component within financial sector portfolios. Historical data spanning from 2015 to 2026 reveals cyclical patterns tied to interest rate environments and regulatory capital requirements.
Data Sources and Verification
“Analyst targets for BARC indicate a maximum of 500.00 GBX and minimum of 350.00 GBX, reflecting significant valuation uncertainty in current market conditions.”
— TradingView Market Data, March 2026
Primary data sources include the London Stock Exchange official company page, Investors Chronicle historical tearsheets, and Investing.com historical data. Long-term price history derives from Digrin monthly archives. For comprehensive historical downloads, Barchart provides extended datasets.
Summary for Investors
Barclays PLC trades at 386.25 GBX, down significantly from 2026 highs but maintaining year-over-year gains of 33.29%. While analyst targets suggest potential recovery to 500 GBX, the absence of verified market cap, P/E, and dividend data necessitates caution. Those monitoring UK financial stocks may also track Creo Medical Share Price – Live Quote, News and Analysis for comparative healthcare sector performance.
Frequently Asked Questions
How to buy Barclays shares UK?
Purchase Barclays PLC shares through UK-regulated stockbrokers or investment platforms offering London Stock Exchange access. Required elements include a funded trading account, completion of regulatory KYC checks, and standard trading fees.
Is Barclays a good dividend stock?
Current dividend yield data is unavailable in verified sources. Historical distributions have varied based on capital requirements and earnings. Consult official investor relations for declared dividend amounts.
Why does Barclays share price differ across platforms?
Discrepancies between TradingView’s 404.45 GBX and LSE’s 386.25 GBX reflect timing differences. The LSE reports official closes with potential 20-minute delays, while other platforms capture after-hours or intraday movements.
What is Barclays’ beta coefficient?
Barclays maintains a beta of 1.676, indicating the stock moves 67.6% more than the broader market. Values above 1.0 signal higher volatility relative to benchmark indices.
How many employees does Barclays have?
Approximately 93,000 employees work for Barclays PLC globally as of March 14, 2026, according to TradingView company data.
What is the Barclays share price forecast for 2025?
Analysts project a range between 350.00 GBX and 500.00 GBX, though specific 2025 timelines are not defined. These estimates depend on interest rates and economic conditions.
Where can I find the Admiral contact number?
For insurance-related inquiries, see Admiral Contact Number UK – Official Phones and Support Hours for verified support channels.
More related posts
 UK State Pension Age Increase – 2026 Timetable and Changes
 Pringles Santa’s Secret Flavour – UK Mystery Christmas Crisp Guide
 Maya Jama: Love Island Host, Net Worth, Dating History
 Anyone Else But You Lyrics – Moldy Peaches Meaning & Facts
 Cinch Stadium at Franklin’s Gardens – Capacity, Seating and Events Guide
 NatWest Bank Near Me: Branches, ATMs & Opening Hours
 Glasgow to London Flights: Ryanair vs EasyJet from €34
 Far From the Madding Crowd – Book, 2015 Film, Where to Watch